Lotsenprojekt die bruecke
March 01, 2011 | categories: jQuery, Web, Python, JavaScript, Programming, Django, Berlin | View Comments
What is the Lotsenprojekt die brücke?
My sister works as a team leader in the Lotsenprojekt die brücke (German) in Berlin Mitte. The basic idea behind this project is to help less integrated people living in Berlin find their way through what can be an impenetrable public authorities system. die brücke helps these people with their everyday issues with finances, habitation and health, primarily by acting as a connector between them and the appropriate authority.

Considering the real world impact that this project has, it's probably the most meaningful project I had the pleasure to work with yet.
Documenting every visit
Part of what the multilingual teams (20+ languages) of die brücke do is they document every client's visit to their offices. This is in order to allow them to analyze and react to the constantly shifting demands of their clients. Among what they record for every visit is:
- Client
- gender
- age
- language
- Issue
- type
- date
- could it be solved?
This is where I came in. 2010 was the first year in which die brücke used a database system for data entry and generating reports, in favour of filling out forms by hand and doing manual statistics with tally sheets and Excel. Furthermore, we've also implemented a searchable directory of authorities and departments which allows the team to increase their service quality.
Public reports
Recently, we've decided to make the reports public. The reports website itself is in German, but here's a little help with interpreting them:
- The overview of types of issues is a stacked bar chart that has general issue types on the Y axis, more concrete issue types represented in the stacked bars, and the number of times those issues occurred on the X axis. (The JavaScript on that page is quite intense, so you might need to wait a little for the page to render.)
- The departments statistics gives an overview of which authorities or departments the clients were brought into contact with, divided by client languages. Here you can see that the Berliner JobCenter was the most contacted authority.
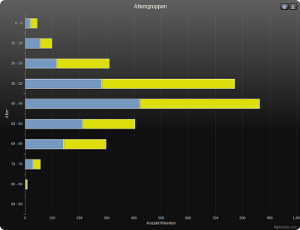
- The age overview allows you to see that most people seeking help with die brücke are between 30 and 50 years old. It also shows you how many of those people were male versus female.
The tabs on the top of the page allow you to navigate to the other statistics.
Under the hood
The data entry and reports were developed with Python, Django, jQuery, Highcharts, DataTables and with some bits of ExtJS.
Django's admin interface turned out to be a good fit for data entry and a time saver.
ExtJS was a source of much frustration, partly because of its monolithic APIs and its poor docs. Which is why I decided I'd no longer use it in future projects. Contrary to the jQuery plug-ins Highcharts and DataTables, which were a pleasure to work with; they do just what they promise and do it well. (The pie charts that require Flash are those that use ExtJS, the stacked bar charts are made with Highcharts, and the tables with DataTables.)